


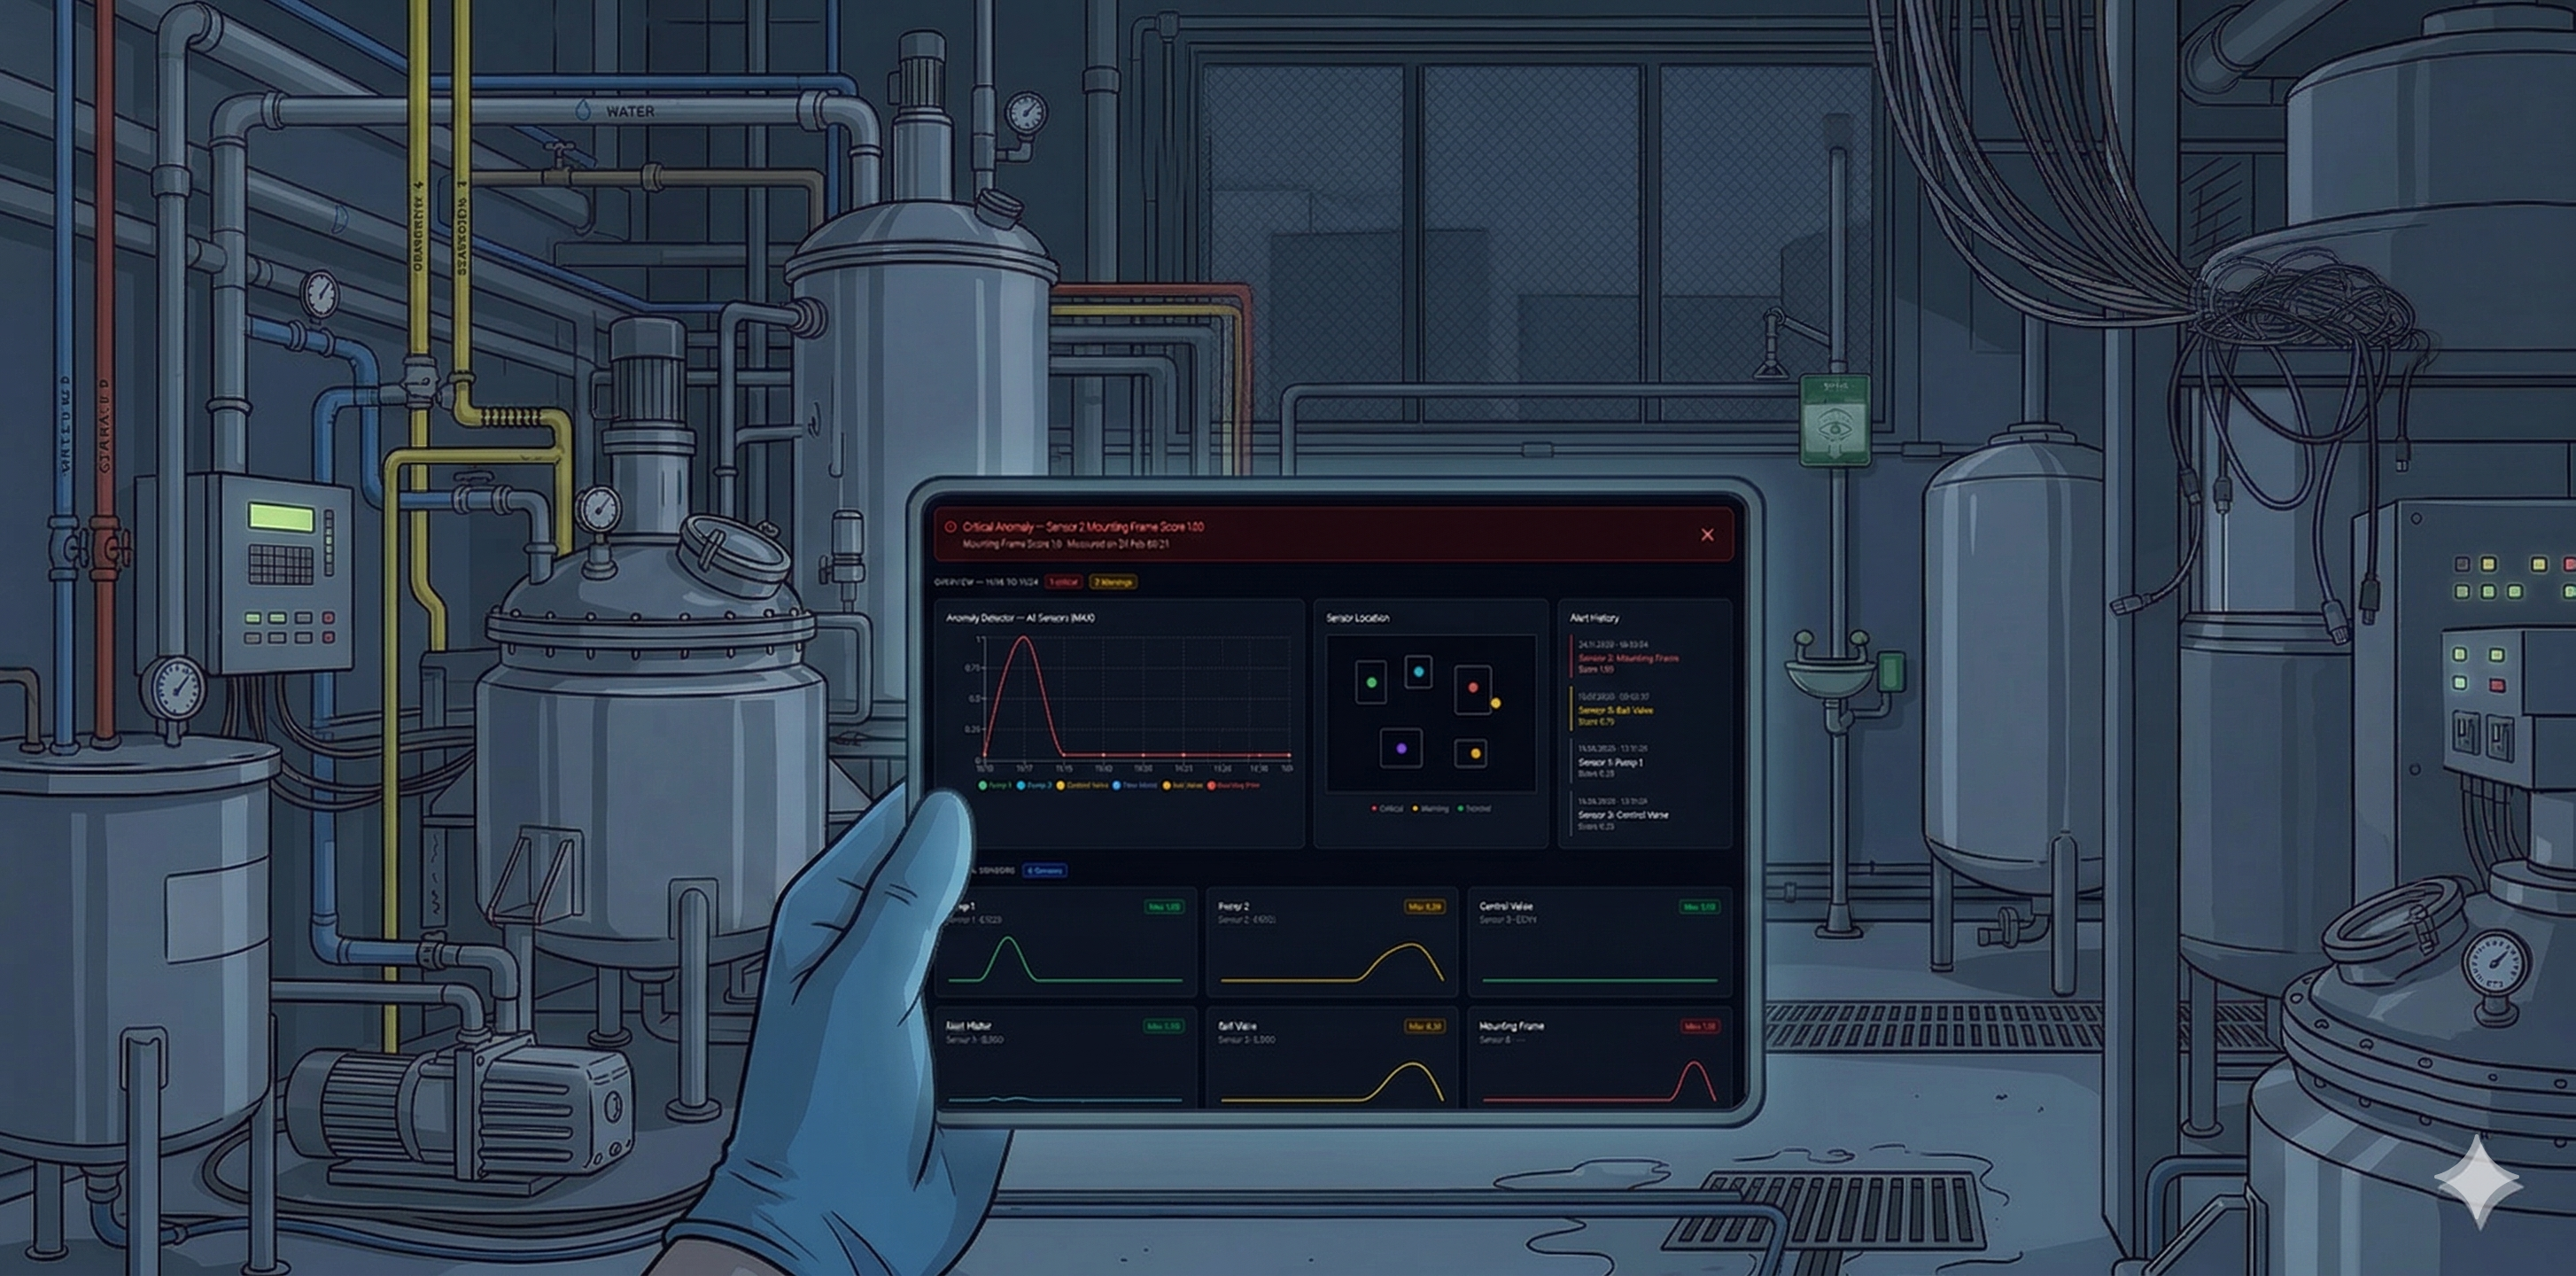
Designing for the Factory Floor: Dashboards for People Who Can't Afford to Misread a Screen
Three industrial monitoring dashboards built in a pre-sales context — where the brief came from commercial, the constraints came from process engineers, and the people using them were responsible for production that couldn't stop.
Role
UX Designer
Context
Bilfinger Group
User
Process Engineers, Operators & Managers
Arc
Brief → discovery → design → client → handoff → onboarding
01 — What these are
Three dashboards, one operating principle: the glance has to be enough
Process engineers and plant operators don't sit in front of dashboards studying them. They glance — and in that glance, they need to know whether everything is normal or whether something requires immediate attention. These three products were each built around that constraint.
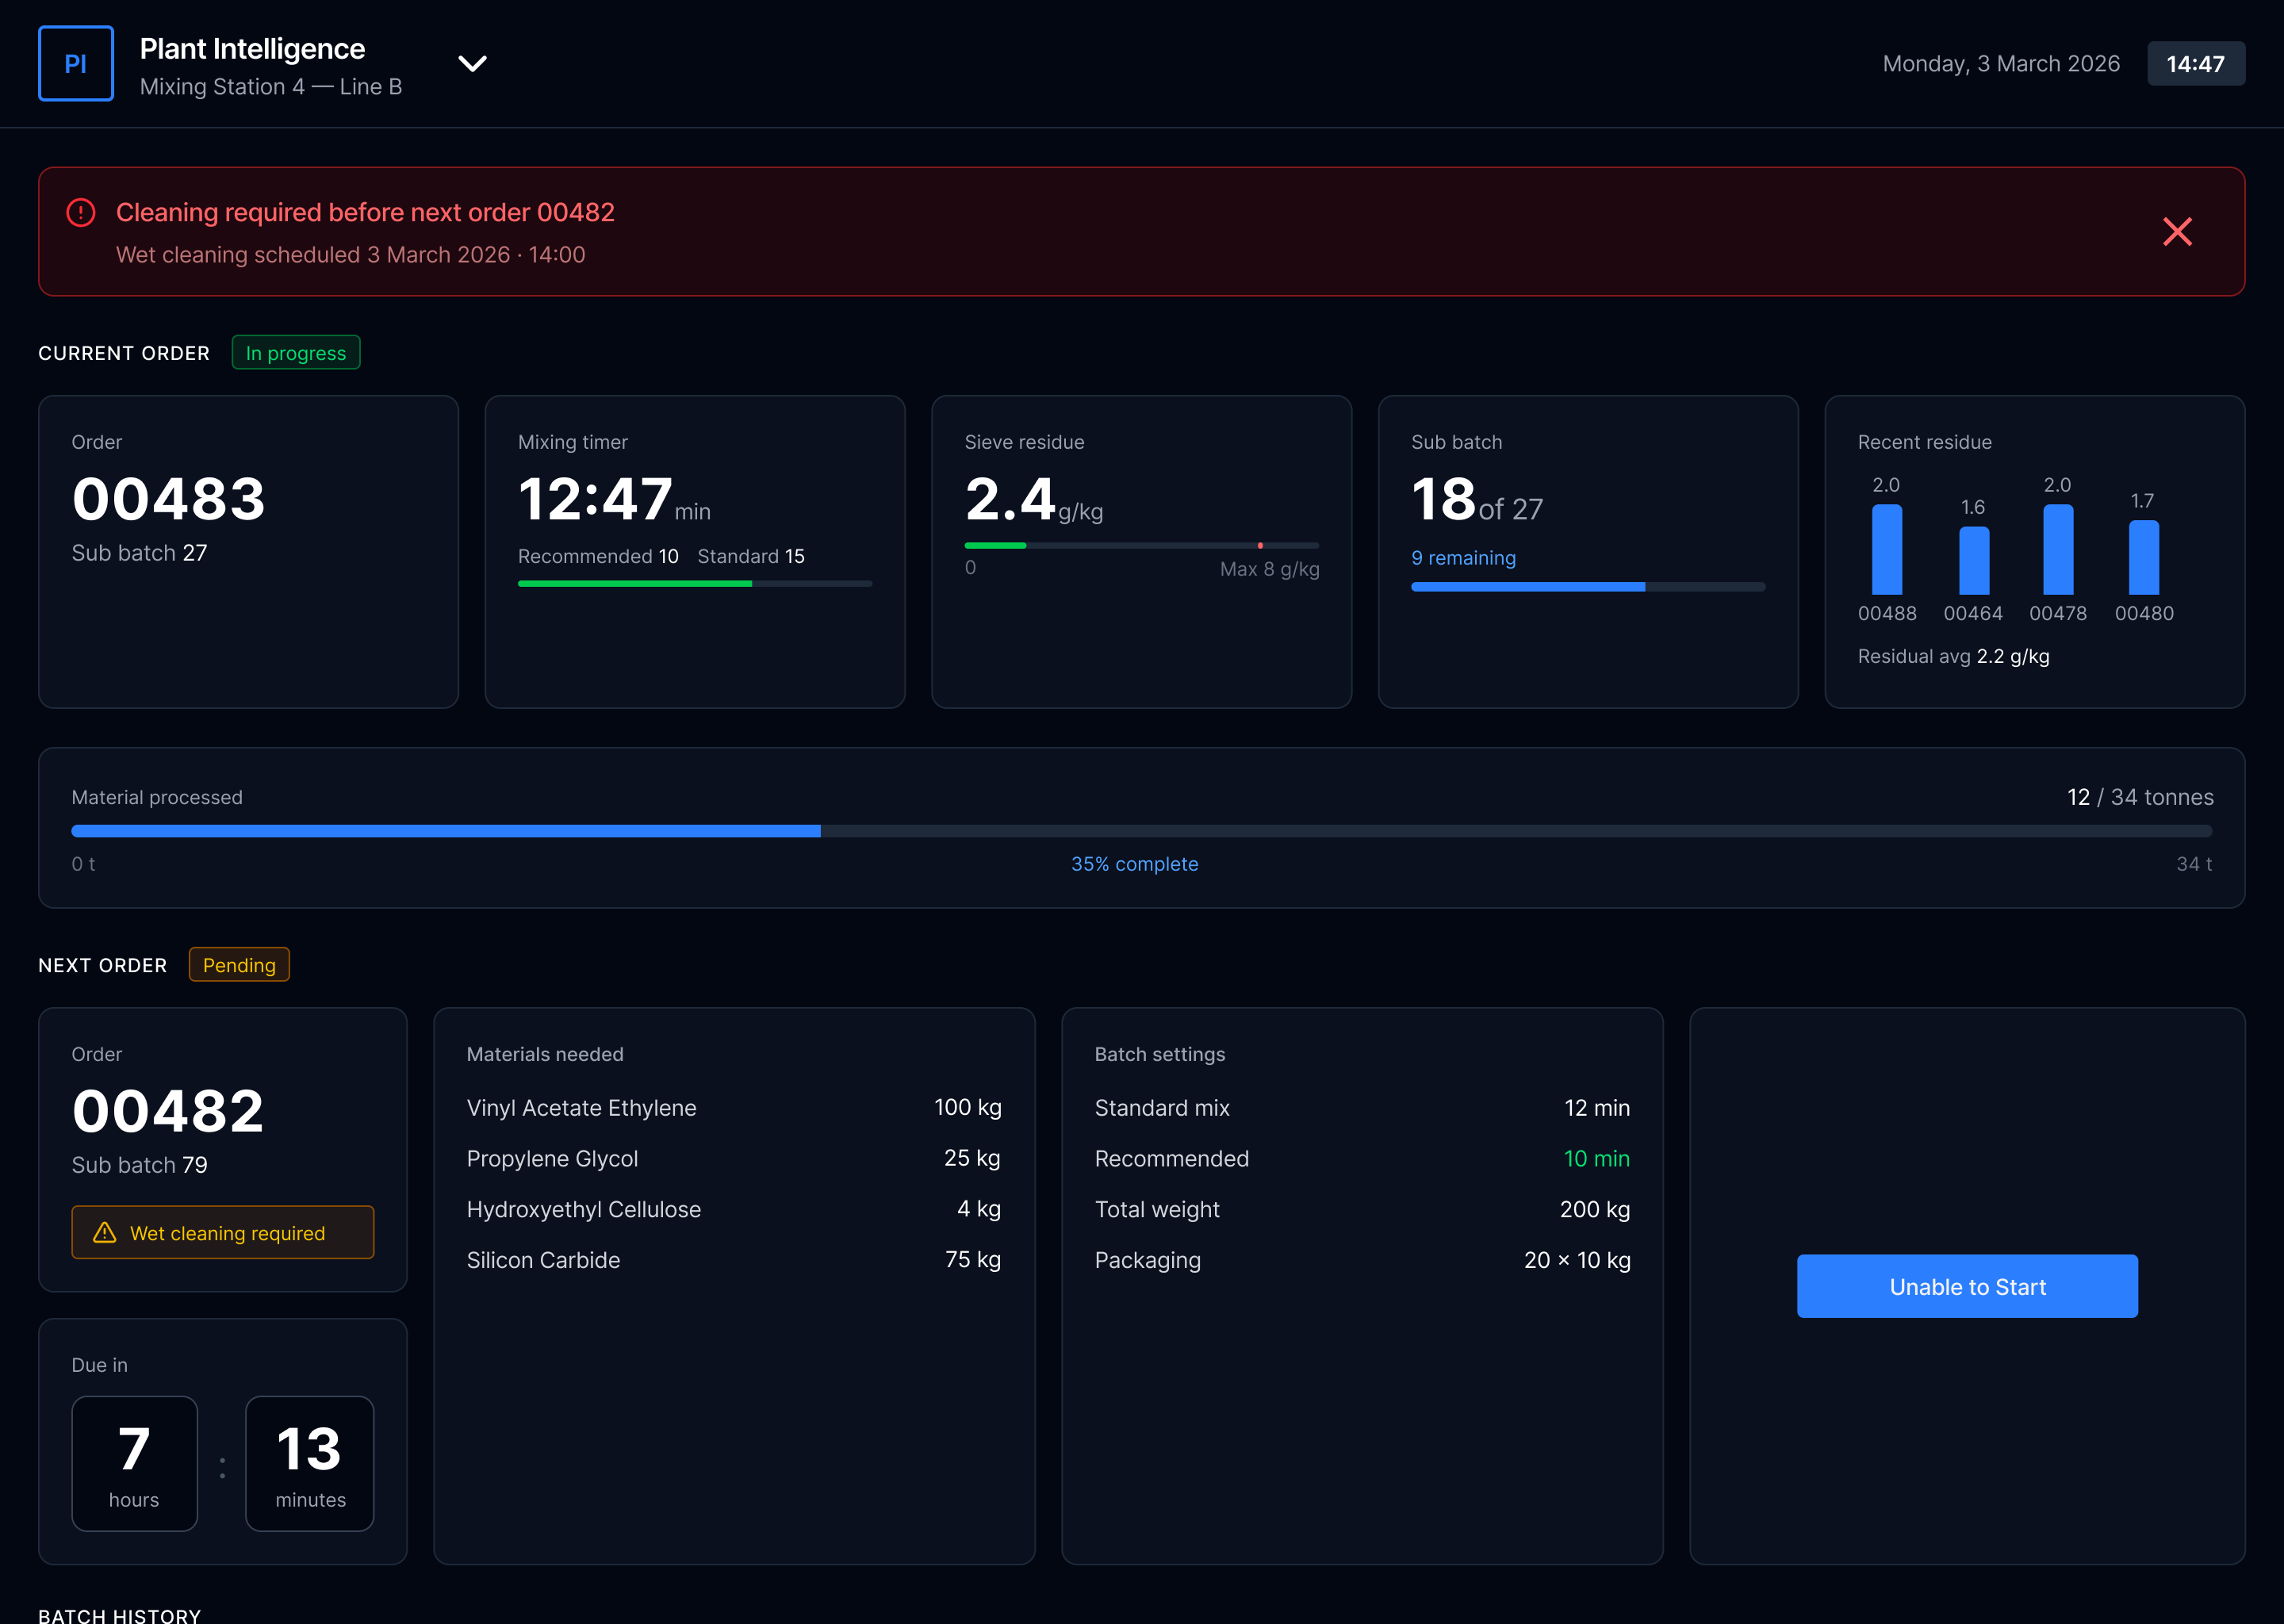
Plant Intelligence
Batch production management — current order, progress, materials, next order queue
Mixing Station
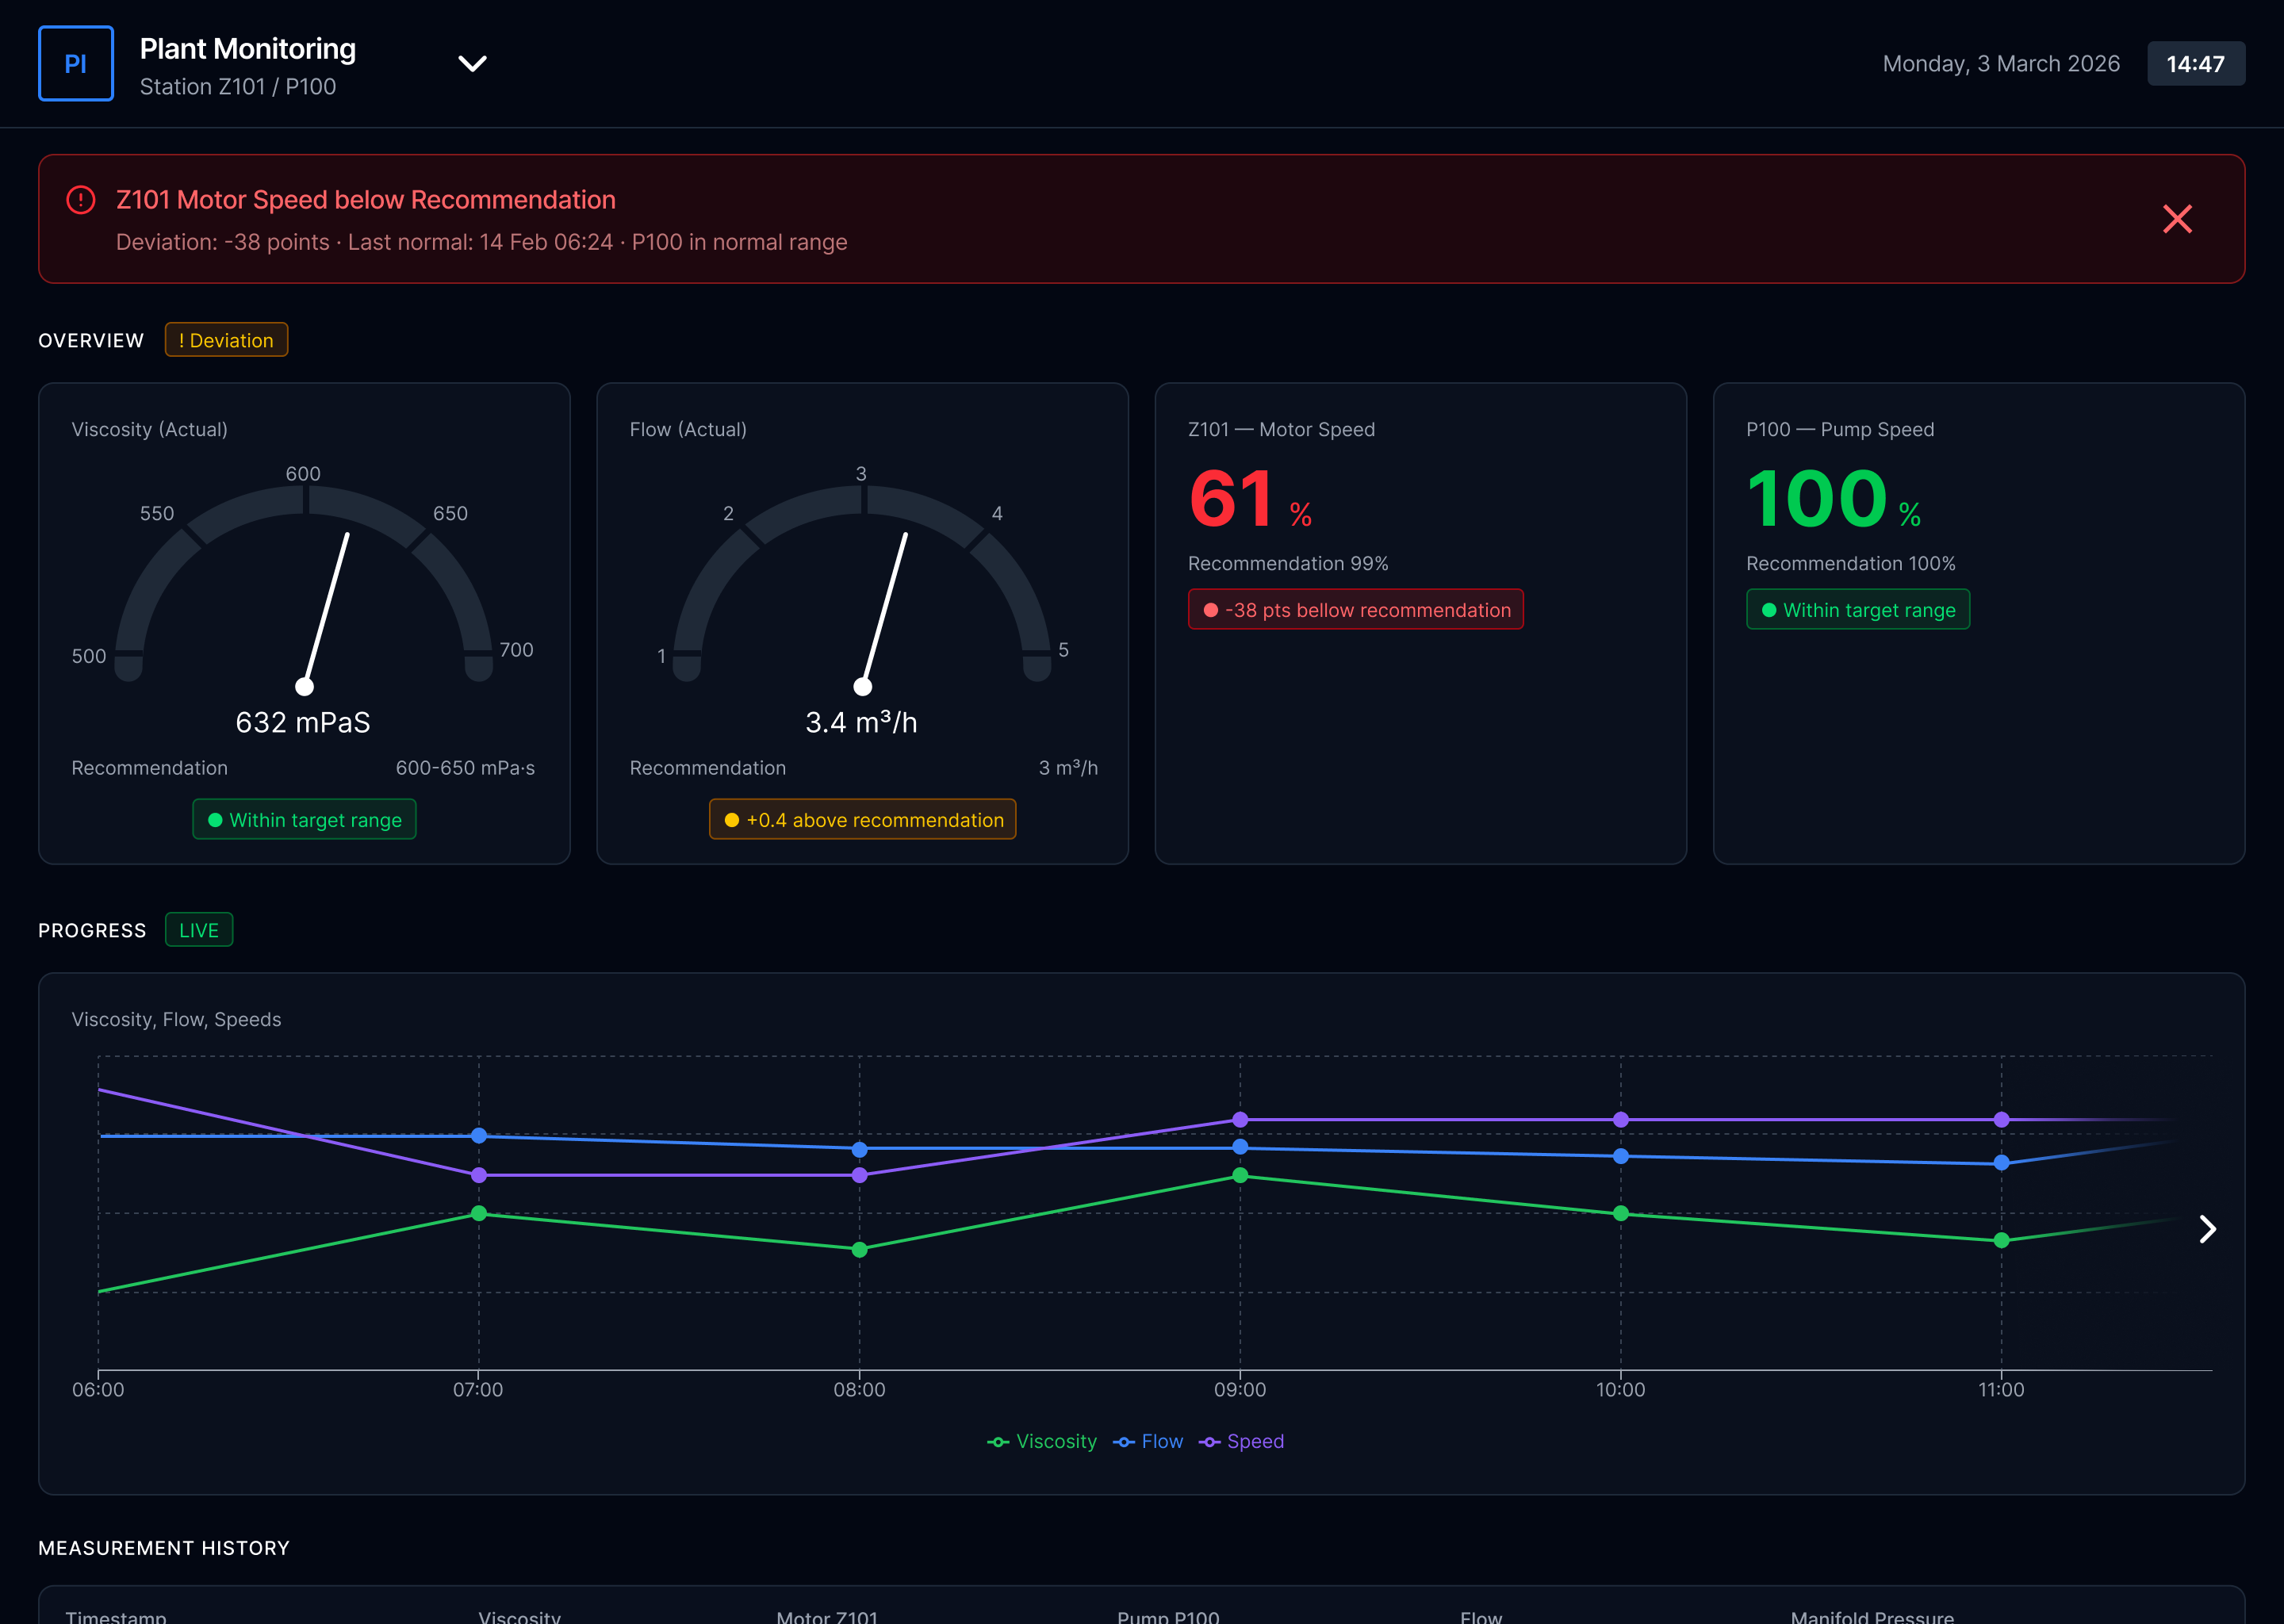
Plant Monitoring
Real-time process parameters — viscosity, flow rate, motor speed with deviation alerts
Live Sensor Data
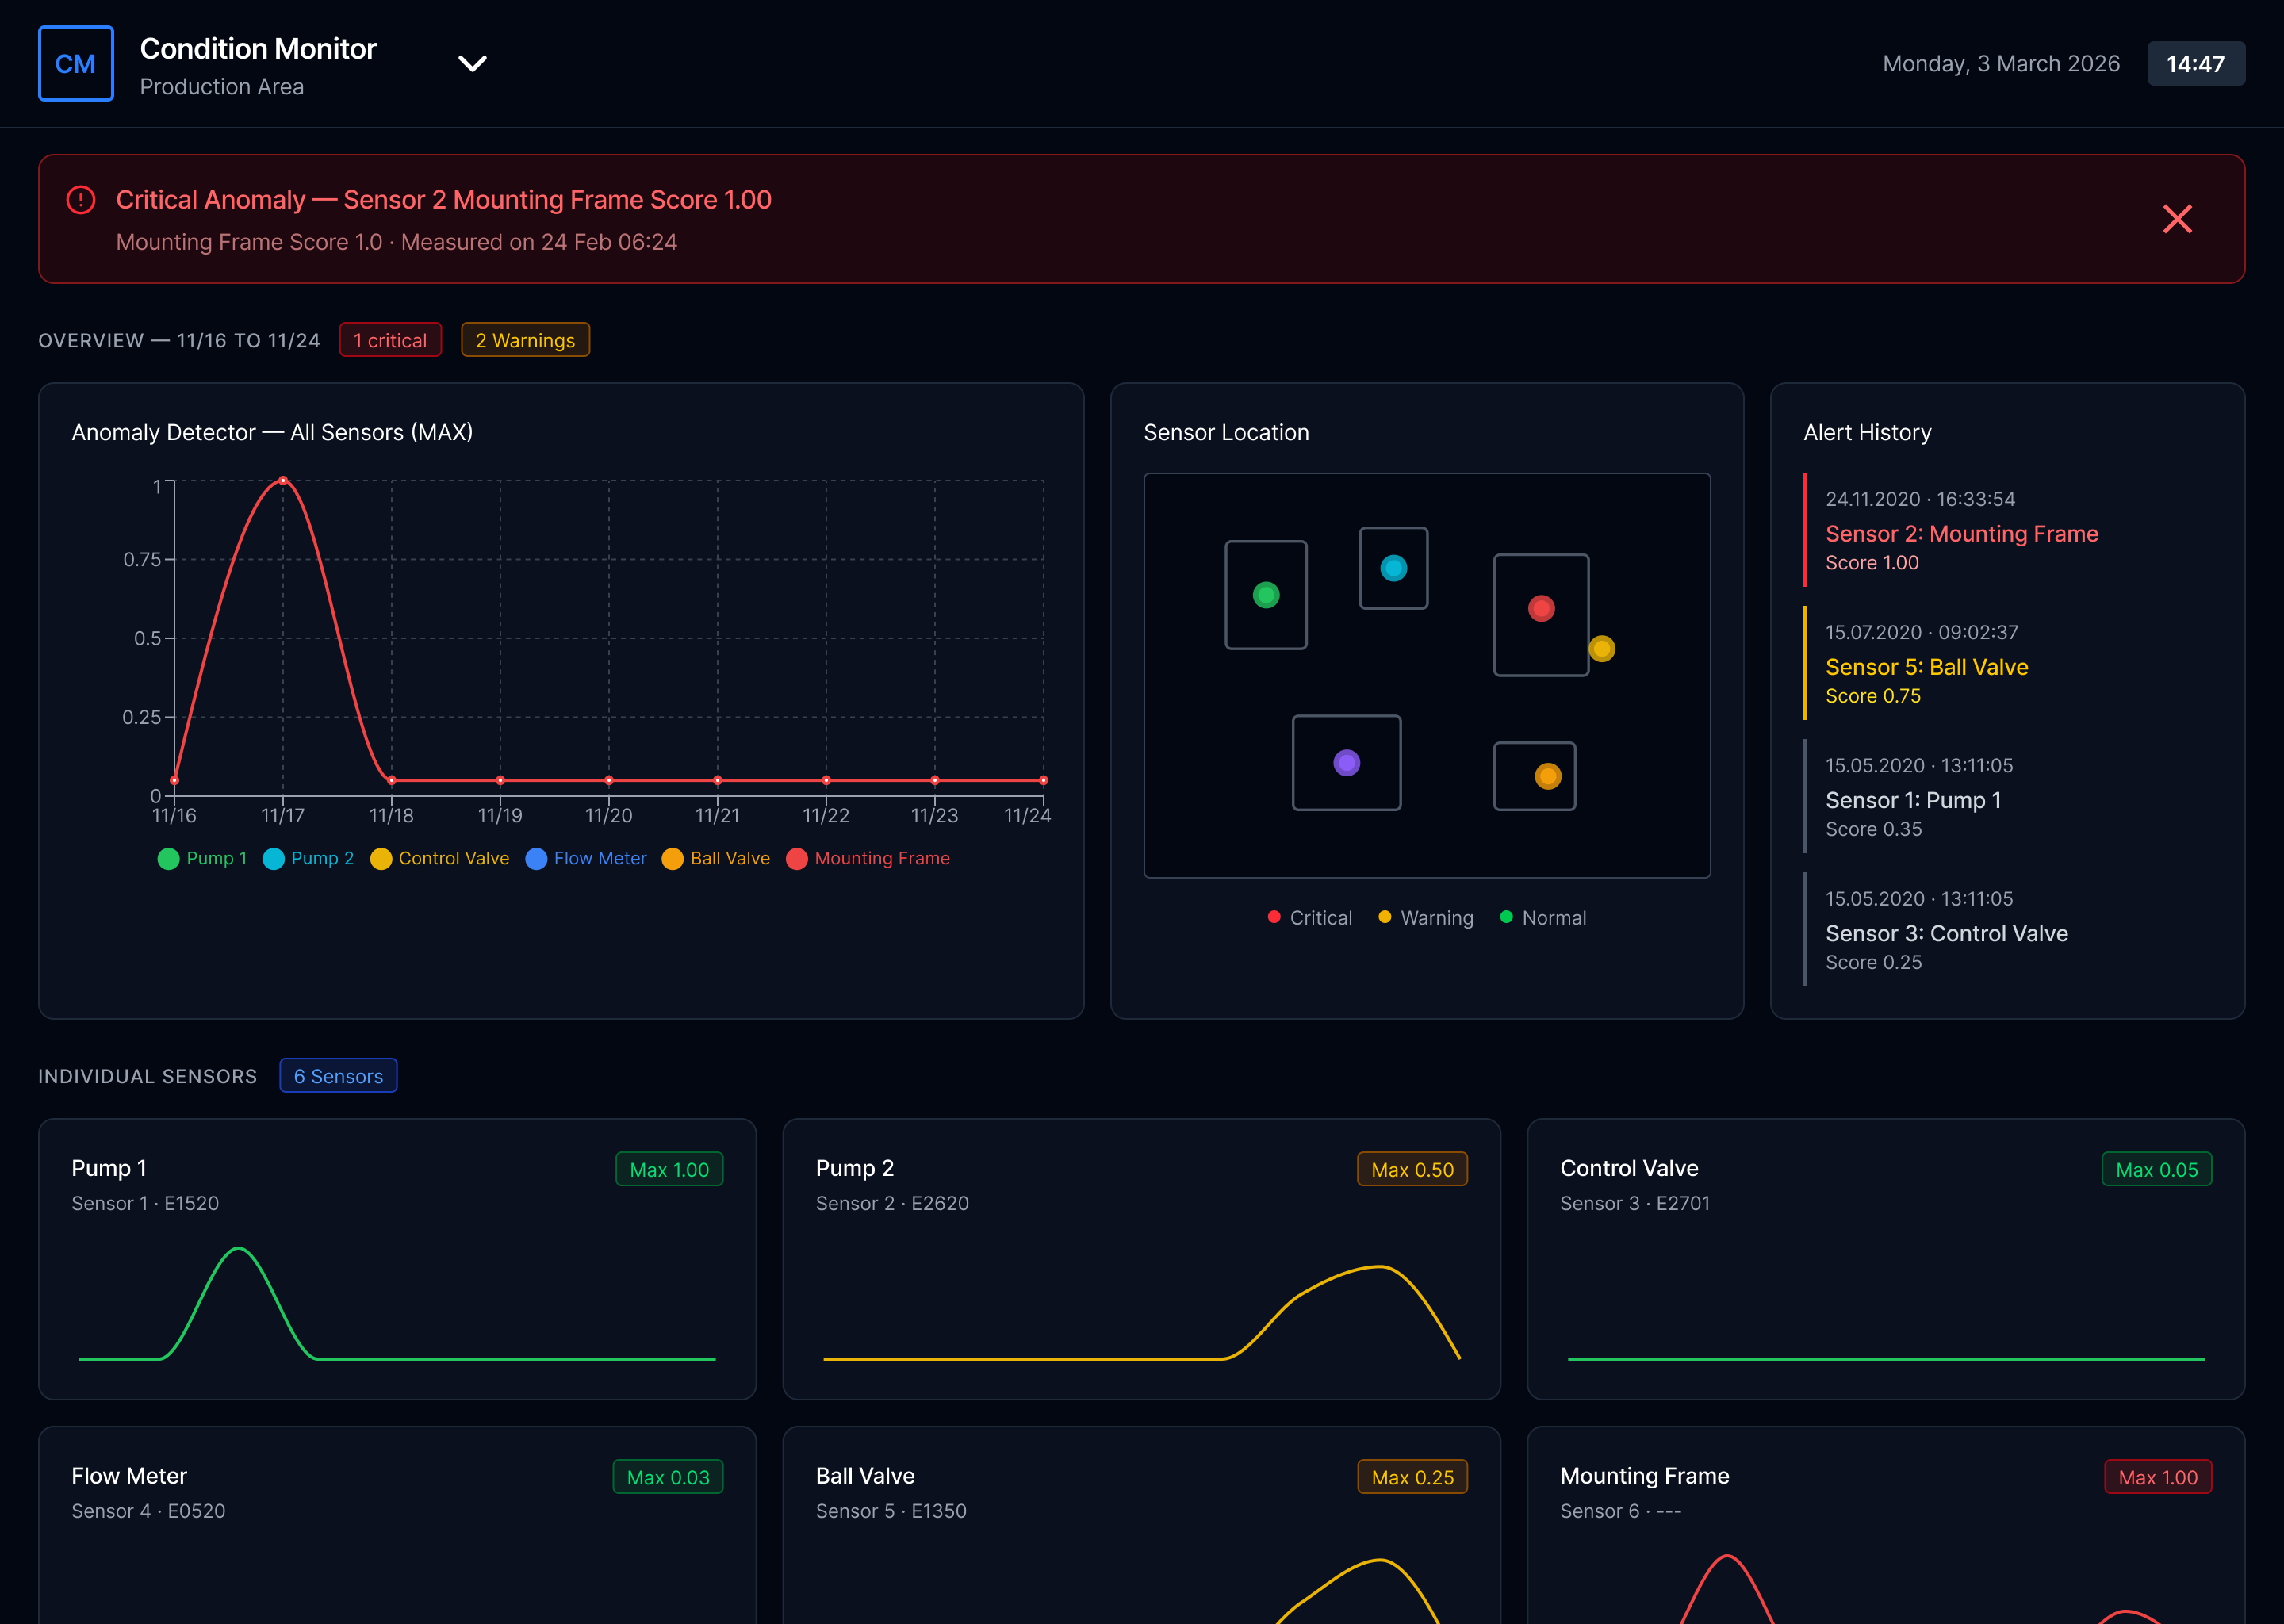
Condition Monitor
Anomaly detection across sensors — location mapping, alert history, individual sensor trends
Anomaly Detection
Each dashboard was built for a different client with a different operational context. The surface-level design language is shared; the underlying information architecture, alert logic, and data hierarchy were rebuilt from scratch for each one.
02 — How I worked
Pre-sales UX: a different kind of brief, a different kind of process
Most UX work begins with an existing product and a user base you can study. This started differently every time. A potential client would express interest, the commercial team would brief me, and from that point I had to get from a vague use case to a deployed, client-trained dashboard — without a formal research phase, always within a commercial timeline.
Commercial
Brief & context
Discovery
Engineer-led
Design & validate
Iterative loops
Delivery
Ship & onboard
PM or marketing brief. Client use case described. Commercial context established.
Joint meeting: engineers, PM, marketing, sometimes client. Then separate session with process engineers — the real brief happens here.
First concept → developer feasibility → back to engineer → client walkthrough → iterate → repeat until aligned.
Developer handoff. Then: manual document, client onboarding session. Full arc owned by me.
The highlighted step — the process engineer session — was where the project actually started. These were the people who understood the client's machinery, sensors, and operational workflow at a level nobody else in the room had. I learned to treat this meeting as the real brief, not the commercial one.
Marketing / PM
Commercial context. Client goals. What success looks like commercially.
Process Engineers
What the factory can actually do. What sensors exist. What operators need to see. The real constraints.
Developers
What's technically feasible. Which data can be surfaced. Implementation effort per design decision.
Client
Operational reality. Specific use cases. The final word on whether the logic makes sense to people who run the factory.
I wasn't able to run formal user research on the people who would ultimately use these dashboards. What I could do was get as close as possible to their domain through the people who understood it most — and remain willing to scrap initial concepts when my mechanical understanding turned out to be wrong. Which it often was.
03 — The Design Challenge
More information on screen does not mean more awareness
The core challenge was consistent across all three dashboards: industrial processes generate enormous amounts of data, and clients initially want to see all of it. The first version of almost every dashboard was too dense. The design work was largely about helping clients understand that a screen which shows everything shows nothing clearly.
"The real question for every element was: does an operator need to see this continuously, or only when something deviates? That distinction — between ambient monitoring and exception alerting — shaped every layout decision."
Three hierarchy principles applied to every dashboard
01
Status before number
Before reading any value, an operator should be able to read the system state. Normal, warning, critical — visible instantly without parsing a number. Color and position carry this; text confirms it.
02
Deviation over absolute value
A motor speed of 61% means nothing without context. "-38 points below recommendation" is immediately actionable. The dashboard should show the gap, not just the reading — because the gap is what requires a decision.
03
Alert with history
An alert that appears without context creates anxiety rather than clarity. Showing when the deviation started, when it was last normal, and what the trend has been turns an alarm into actionable information an operator can respond to with confidence.
Plant Monitoring Dashboard
04 — The moment the brief changed
The client asked for monitoring. I noticed they also needed prevention.
The Plant Intelligence dashboard started as a straightforward monitoring brief: track batch production in real time. Current order, progress, materials, timing. Show the operator what's happening.
The insight that changed the scope
Production can't always start when it's scheduled — but nothing in the system reflected that
Working through the process with engineers and operators, a pattern kept emerging that nobody had explicitly mentioned in the brief. A machine might need cleaning before a new batch could run. An ingredient might not be ready. The previous batch might be running behind. In the existing workflow, this was handled informally — operators would check, communicate, delay. There was no system-level mechanism to prevent a production order from being started in conditions where it would fail or cause contamination.
I proposed adding it. If the conditions for starting an order weren't met, the system should reflect that state clearly — halt the automatic process, surface the specific blocker, and hold the batch in queue rather than allowing an operator to force-start something that wasn't ready.
Original brief
Show current batch status and progress
Display materials and timing
Queue next order information

What was added
Machine readiness state — cleaning required before start
"Unable to Start" — blocks order if prerequisites unmet
Automatic process halt — batch returns to queue safely
The client was initially skeptical — this wasn't what they'd asked for. When I explained the reasoning — tracing it back to what the engineers had described about their actual workflow — and reframed it as the dashboard preventing the wrong action rather than just showing the current one, the conversation shifted. This became one of the features they valued most.
05 — Client validation
Skepticism is the starting point. Logic is how you move past it.
Clients in the process industry are cautious by nature. They operate environments where a mistake has real consequences — production losses, contamination, safety incidents. A new digital interface is not inherently reassuring to someone who has managed a factory floor for twenty years.
Every client walkthrough followed a similar dynamic. The first reaction was careful scrutiny rather than enthusiasm. "Why does it show this?" "What happens if this number changes?" "What does this color mean exactly?" I didn't respond by defending the visual design. I'd explain the decision logic directly — here's the information this element shows, here's why it sits where it does, here's what the system does when this threshold is crossed, here's what we decided not to show and why.
When the client wanted a different direction
If their reasoning came from specific operational knowledge I didn't have — and often it did — I'd iterate. I wasn't attached to the initial design; I was attached to the logic. If their reasoning was stronger, the design should change.
When technical questions exceeded my domain
The process engineers who had worked with me through design were usually in the room. When discussions became too technical for me to navigate alone, they could step in and translate between the client's operational reality and my design decisions.
06 — Beyond the screen
The design doesn't end at handoff. Neither did my involvement.
After the dashboard was deployed, I was assigned to write the client manual and run the onboarding session. The reasoning was practical: I was the only designer, I understood what every element meant, and the manual needed to be a visualized booklet that required design skills to produce.
Writing the manual taught me something the design process itself hadn't surfaced. Describing every element in plain language forced me to notice which ones needed more explanation than they should have. If a paragraph was needed to explain what a visual indicator meant, that was usually a signal the indicator wasn't communicating its meaning clearly enough on its own.
"The best design is the one that doesn't need a manual. In a product like this, the manual is still necessary — but writing it reveals the gap between what you think the design communicates and what someone encounters for the first time."
It's the feedback loop that formal usability testing would have surfaced earlier in the process. In a pre-sales delivery context with no research budget and a commercial timeline, it surfaced at the end. I now try to document as I design — not as a deliverable, but as a test. If I can't explain a decision clearly in plain language, the design decision probably isn't right yet.
Design phase
Structural clarity; hierarchy of information
Writing phase
Plain-language test: reveals which elements need too much explanation
Onboarding
Real user encounter — where assumptions break down in real time
07 — What I learned
Three things specific to designing for industrial contexts
01
Domain knowledge is a design input, not background reading
The process engineers weren't stakeholders to manage — they were co-authors. Every time I tried to work from second-hand information, the concept was wrong. Every time I went back to the engineer directly, it improved. In complex technical domains, humility about your own understanding is a design skill.
02
Industrial clients don't trust what they can't explain to themselves
A dashboard that looks impressive but can't be interrogated will be abandoned. The design has to be logically legible — an operator should be able to explain to a colleague why the system is showing what it's showing. That's a higher bar than typical consumer UX, and it changes what "simple" means.
03
The brief is always incomplete — your job is to find what's missing
The "Unable to Start" state wasn't in the original scope. It existed in the client's operational reality but hadn't been translated into a product requirement. Finding those gaps — and proposing solutions to problems the client hadn't formally articulated — is what moves the work from executing a brief to genuinely improving how the factory operates.
← Previous case study
UXIM: A Prioritization Methodology
Bilfinger Group
Next case study →
In-car infotainment system
CARIAD / Volkswagen Group
© 2025 Michael Gibran